
Ichimoku Kinkō Hyō or Ichimoku for short is a technical indicator that helps traders to predict future price movements and market momentum and find support or resistance areas. It’s a combination of indicators that can give an overview of the market and help traders and investors to gauge the direction of the price using an all-in-one indicator in their technical analysis.
Ichimoku consists of 5 components: Tenkan Sen (the conversion line), Kijun Sen (the baseline), Senkou Span A (leading span A), Senkou Span B (leading span B), and the Chikou Span (lagging span). The way these components react to one another or to the price can give us further insights into the markets.
Now, let’s see what each of these components represents and how we can use them in our trading.
Ichimoku Kinkō Hyō or Ichimoku for short is an all-in-one indicator that can be used for gauging price movements and trends, market momentum, and potential support and resistance levels. The indicator is calculated based on moving averages that measure the average price of an asset over a preselected period of time.
Ichimoku consists of 5 different components which together help traders and investors with their market analysis. We will discuss these components in detail in the next section. For now, let’s see what the Ichimoku indicator looks like on a chart.
You can see an example of the Ichimoku indicator below.
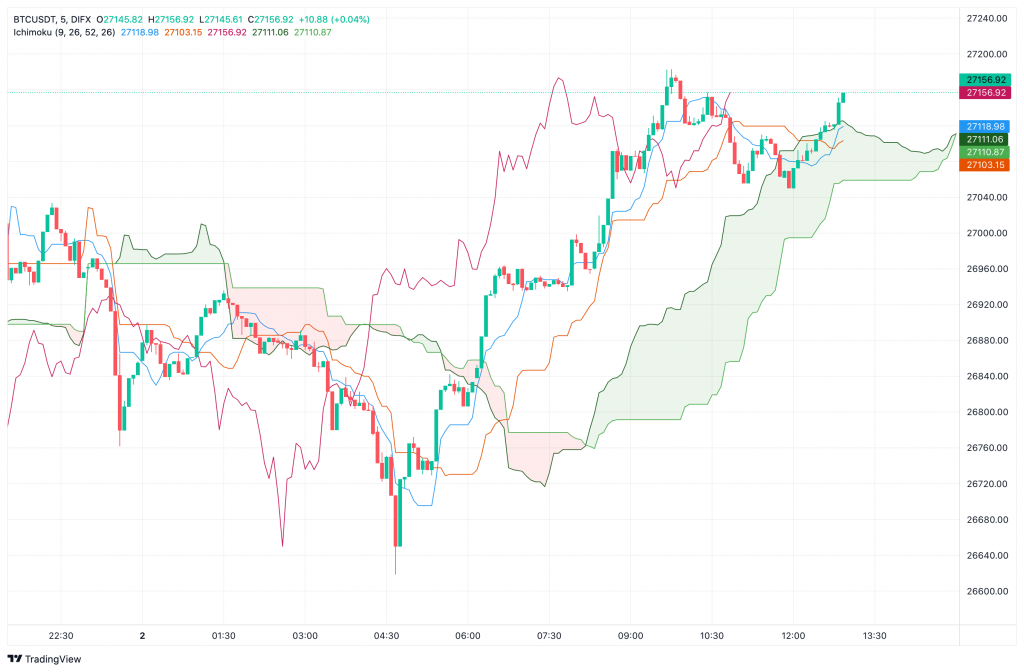
The Ichimoku indicator on a Bitcoin chart on the DIFX spot exchange
All the lines and shapes may seem confusing at first glance and you may think the Ichimoku indicator is too complicated to use. But once we go through all the components and what they are used for, you will see how easier and more clear everything will become.
But before getting into the 5 components of the Ichimoku indicator, let’s take a quick look at its history and the mastermind behind it.
A Japanese journalist named Goichi Hosoda created the Ichimoku indicator in the late 60s. Hosoda wanted to integrate different indicators into a single one to give traders and investors a comprehensive tool to gauge and analyze the markets.
This vision is also reflected in the title as “Ichimoku” translates to “one look” in Japanese.
The Ichimoku indicator consists of 5 different components:
Let’s take a look at the previous Bitcoin chart again and locate these lines on it.
The position of the price compared to different components of the Ichimoku indicator or the way different components are reacting to one another can give us insights into the markets and the direction the price is headed.
As mentioned above, the Ichimoku cloud is formed based on the leading span A (Senkou Span A) and the leading span B (Senkou Span B).
If the price of the asset is above the cloud, we can say that the trend is positive and consider it as a bullish signal. Conversely, if the price is below the cloud, we can expect a negative trend and consider it a bearish signal.
With the Ichimoku indicator, we can have different crossovers which can be bullish or bearish.
When Tenkan Sen (the conversion line) which is the shorter-term average crosses Kijun Sen (the baseline and the longer-term moving average) to the upside, the crossover can be considered bullish. On the flip side, when Tenkan Sen breaks Kijun Sen to the downside and moves below it, we can consider the signal bearish.
Senkou Span A and Senkou Span B can also have bullish or bearish crossovers. Buyers are in power when Senkou Span A crosses above Senkou Span B, indicating a bullish signal. On the other hand, sellers are controlling the market when Senkou Span A moves below Senkou Span B, showing a bearish condition.
The position of the crossover is another factor that we need to pay attention to. A bullish crossover above the Ichimoku cloud can give us more assurance over the bullish condition that a bullish crossover below the Ichimoku cloud.
When Chikou Span or the lagging span and the price cross each other, a trend reversal may be imminent.
Additionally, when Chikou Span crosses the price to the upside, the market is signaling a bullish condition while an up-to-down crossover can be considered bearish.