
Support and resistance are two of the most commonly used and fundamental concepts in technical analysis.
The concept of support and resistance is quite simple to understand:
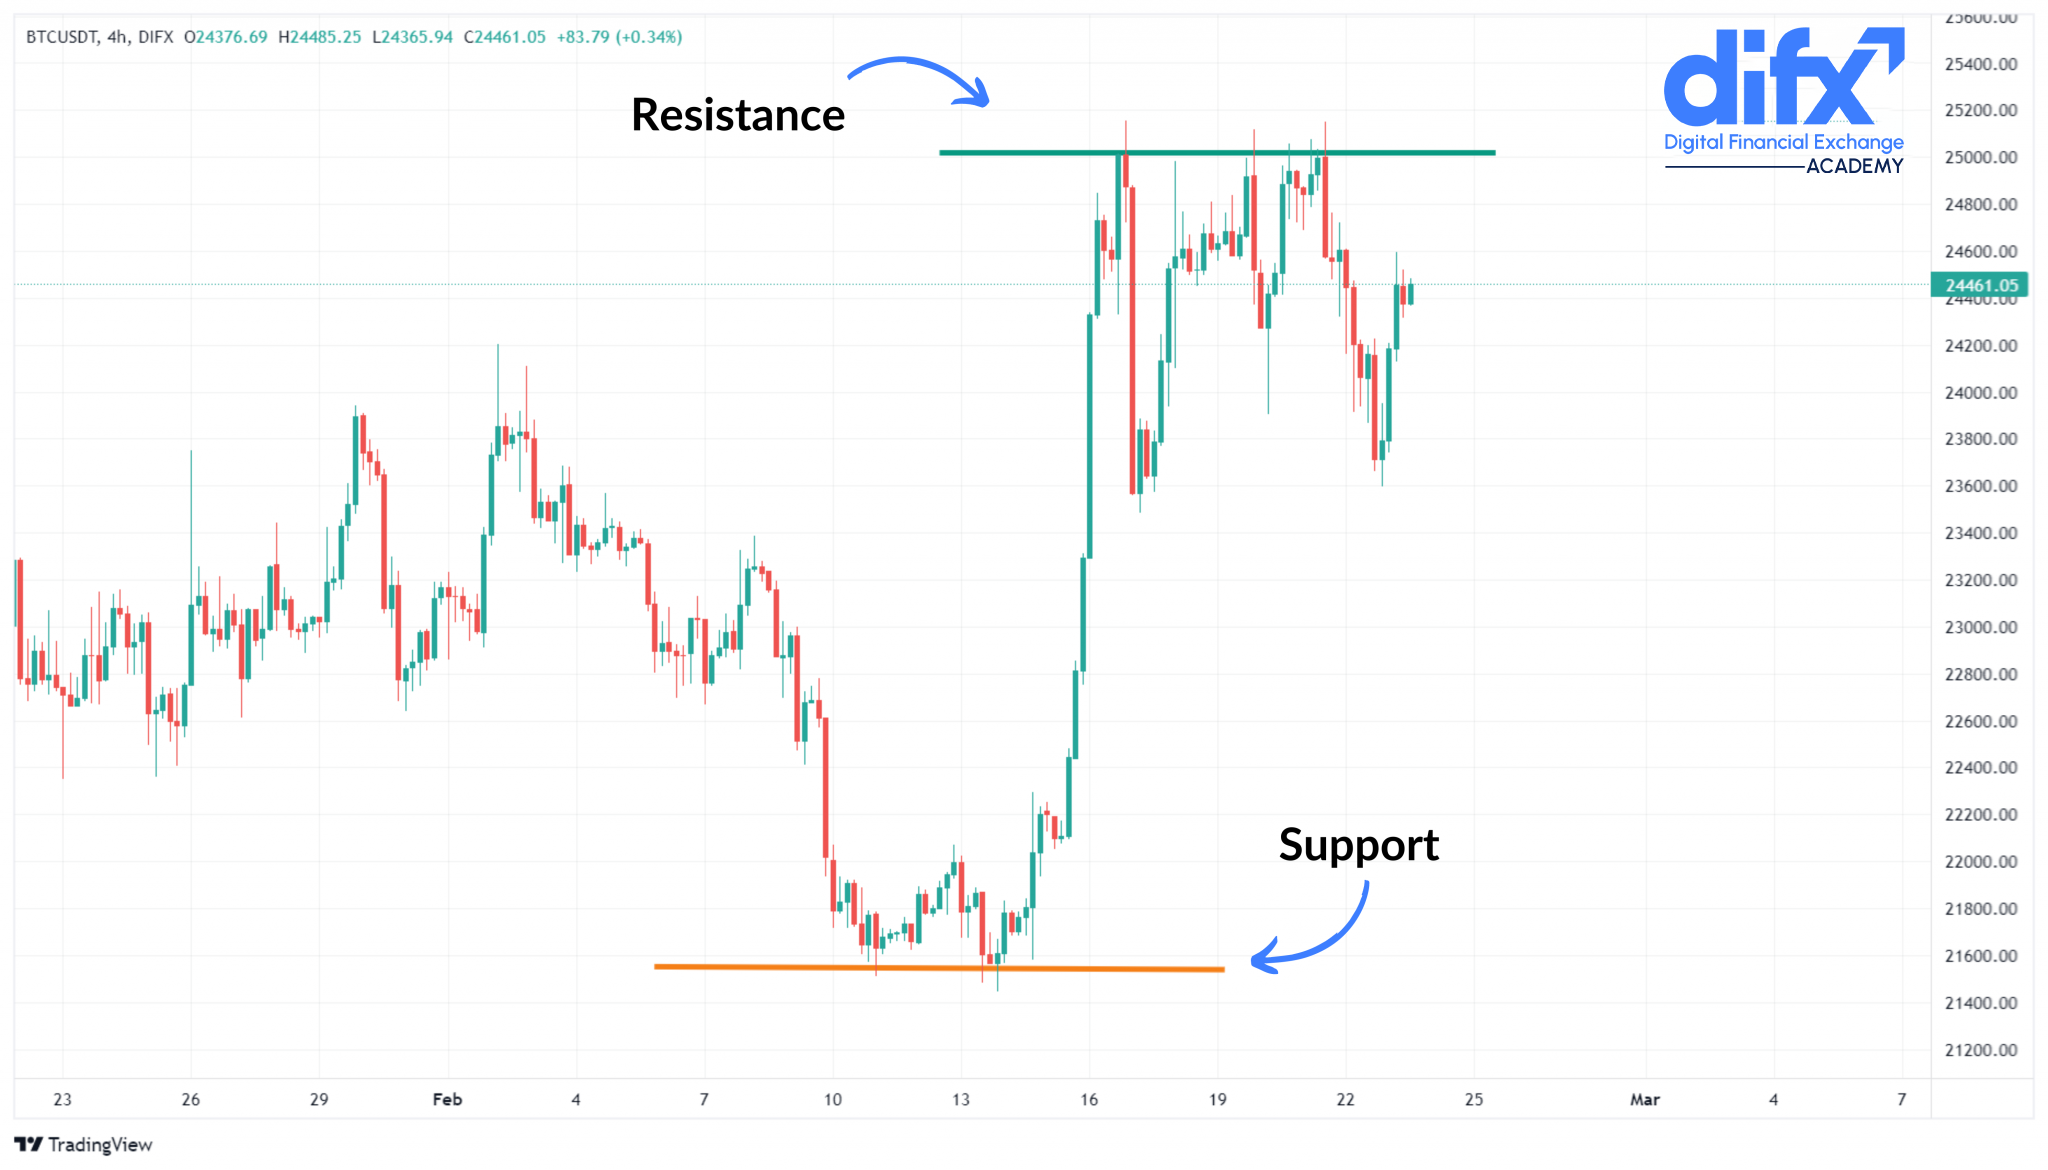
They point out to levels where the price could not move below or above. In other words, resistance is a level where the price finds its top while at the support level, the price would bottom.
Market psychology is quite important and needs to be considered when working with support and resistance levels.
Additionally, technical indicators like moving averages can be used for identifying support and resistance levels.
In this article, you will learn about the concept of support and resistance and how you can use them in your market analysis.
Market prices are driven by supply and demand. When supply is greater than demand, the prices start to go down. In this situation, the number of sellers is more than buyers.
Uptrends are the opposite. Demand is greater than supply, meaning we have more buyers in the market than sellers.
Additionally, prices move sideways when there is an equilibrium between supply and demand or buyers and sellers.
Once one group gains the upper hand over the other, the price will take a new direction, either upward or downward.
Support and resistance are the points where the control over markets shifts between buyers and sellers or simply settles at a balanced place.
Simply put, support and resistance levels are areas where the price will likely change direction or stop its current trend.
When working with support and resistance, we need to take into account market psychology.
The reason for this is that traders and market members remember the previous price movements and the areas of interest.
Generally, they keep an eye on these areas and expect the price to react to these levels.
This is somehow similar to the concept of self-fulfilling prophecy where the expectations can influence the behavior of the people involved, leading that expectation to reality.
In uptrends or downtrends, the price may find a level at which it cannot move beyond it. These price levels are simply known as support or resistance.
In an uptrend, we can say that the price will not increase indefinitely and there will be a place where the price cannot move above.
We call that place resistance where the price has probably found its top and would stop its uptrend or reverse its direction altogether.
In a downtrend, on the other hand, the price may drop to zero. For instance, if a company goes completely bankrupt, its stock prices can lose all their value and drop to zero.
However, in a normal market situation, the price of an asset would eventually stop its downfall at some point. That point, where the price has found its bottom, is called support.
After hitting the support, the price would probably stop its downtrend or even start increasing again.
Moving averages are a commonly used technical indicator that help traders to distinguish the direction of the price by smoothing out fluctuations.
With moving averages, it would be easier to find support and resistance levels for an asset as the price movements are smoother. Therefore, traders and investors can consider moving averages as natural support and resistance levels.
As you can see in the chart below, the 15-day simple moving average is acting as a support when the price is going up and as a resistance when the price is falling.
You can simply try moving averages with different time slots to see which one suits your selected time frame better.
In our example, the price of Ether reacted to the 15-day simple moving average quite well.

Support and resistance levels can switch positions as the price breaks and pass through them.
In other words, a support level can turn into resistance once the price has dropped below it.
The same rule applies to resistance levels. They can turn into supports when the price breaks them to the upside.
The price tends to test support and resistance levels before completely breaking them.
We can say that a support or resistance level is completely broken once the price is closed beyond that level.
So when the wig of a candlestick has passed through the support or resistance, the price is testing the level. However, this may not always be accurate.
As the price touches a support or resistance level more and more, the level becomes more significant.
The reason for this is quite simple.
As the price constantly fails to break through these levels, more market members recognize them as areas of interest and may place orders around these levels, making them even stronger.
Therefore, if the volume of trades is greater around a level, the support or resistance becomes stronger.
The timeframe is another factor that may have an effect on the strength of a support or resistance line.
Support and resistance levels on longer timeframes are usually stronger than those you may find on shorter timeframes.
The strength of the support or resistance level becomes important when the price breaks it. If the level was strong, you can expect a sharp price movement to follow.
Generally, support and resistance levels present ideal places for placing orders.
When approaching a support or resistance level, the price may bounce off the level or break through it.
Based on this, traders and investors can consider these levels as entry or exit points and place their orders. Therefore, you can either trade the bounce or the breakout.
Let’s say you expect a strong support level to hold. As the price is nearing this level, you enter the market and buy as you believe the price will bounce off the level and start rising again.
You can also manage your positions based on breakouts.
Simply put, breakouts happen when the price of an asset breaks a resistance level to the upside or falls below a support level.
For example, you expect the price of an asset to start a strong uptrend soon. The price has been testing the resistance level frequently and you are waiting for the price to break this level as a confirmation of the uptrend.
When the price passes this level, you enter the market and buy your desired asset. However, you have to remember that not all breakouts may be real.
False breakouts happen when the price does break the support or resistance level, but it is not strong enough to continue its direction.
As a trader, you need to always think of proper risk management and never invest more than you can afford to lose.
You can read our “5 Risk Management Techniques For Traders” article to learn some of the most useful risk management techniques in trading and apply them in your trades.