
Trend lines are one of the most common and primary patterns used in technical analysis and a part of more sophisticated chart patterns like channels and wedges.
Trend lines consist of at least two price points and traders and investors use them to see the market direction and price movements more clearly. Market analysts also use trend lines to find support and resistance levels on the charts.
In this article, you will learn about trend lines, their types, and how you can use them in your market analysis.
Simply put, trend lines help traders and investors to see the market direction more clearly. As prices fluctuate within markets, it may become complicated to catch the exact direction the market is headed.
This is where trend lines can help.
We can have a trend line by connecting a few main price points on the chart over a selected period of time.
Therefore, to draw this line, we need at least two price points, however, more points would increase the validity of the trend line.
Additionally, there is no restrictive rule in choosing the timeframe in which the trend line is drawn. The trend line will simply show us the trend of the price regardless of time.
A trend line is an indication of the supply and demand in the markets as well. An upward trend line indicates that buyers have the upper hand in the market and the demand is greater than supply.
Conversely, a downtrend shows excessive supply and tells us the sellers are controlling the market.
Additionally, trend lines are quite useful when it comes to finding support and resistance lines. Support and resistance are important levels on a chart where the price cannot easily move beyond. Along with other factors, traders and investors look into these levels carefully to find good investment opportunities.
Basically, trend lines can either be upward or downward.
As the name suggests, an upward trend line (ascending) is formed when we connect at least two low prices. It’s evident that the second low should be higher than the first low (a higher low) for the trend line to be upward.
This indicates that the market is experiencing an uptrend where bulls are driving the market.
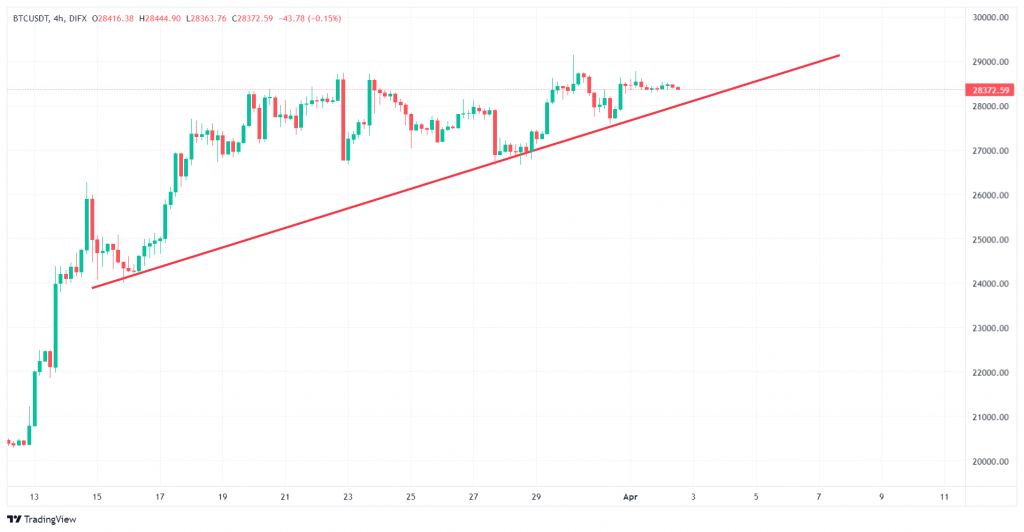
You can see an ascending trend line in the Bitcoin chart below. By connecting three higher lows, we have plotted an upward trend line which gives us an idea of where the market is headed.

A downward trend line (descending), on the other hand, is created when we connect at least two high prices by a line. Here, to have a downward line, the first high should be lower than the second high (a lower high).
This indicates that the market is going through a downtrend and bears are controlling the market.
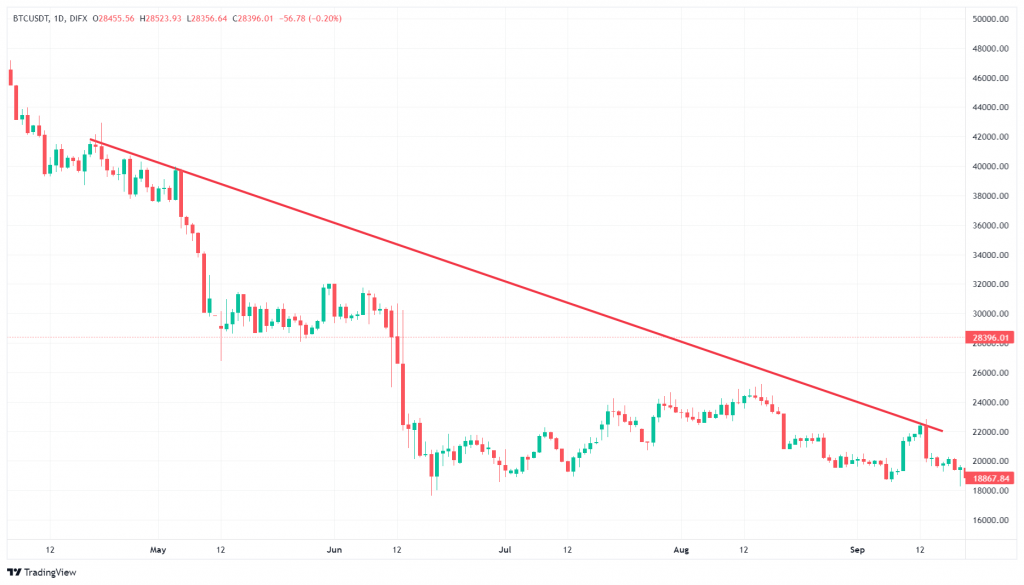
Check out the Bitcoin chart below. Here, we have a descending trend line that consists of three lower highs. The trend line indicates a downward price movement for the asset.
To draw a trend line, we need to first find at least two interesting highs or lows on the chart. However, as mentioned before, more points add more validity to our trend line.
More points simply indicate that the price is touching or testing the line over and over without breaking it. This makes our trend line more valid, suggesting that the price may react similarly in the future.
Let’s see this with an example.
In the chart above, the price has tested the trend line three times without breaking it. We consider a trend line broken or invalidated once a candlestick is closed below or above the line.
We have continued the trend line in the future and will be watching to see how the price will react to it. If the price couldn’t fall below the trend line, we can say the trend line is valid and is acting as support for the asset.
Traders and investors mainly use trend lines to see the overall trend of the market and find support and resistance levels. An ascending trend line usually acts as a support level while a downward trend line can behave like a resistance level.
As mentioned earlier, an ascending trend line indicates an uptrend, suggesting that demand is greater than supply. An ascending trend line will stay valid as long as the price is not closed below it. Once the trend line is broken, a price reversal can be expected in the future.
Descending trend lines usually act as resistance and will stay valid as long as the price is trading below them. Once the price is closed above a descending trend line, the trend line is broken and a change in the market trend may be imminent.