
A Moving Average (MA) is a technical indicator that helps traders and investors to understand the price trend easier. As the name suggests, moving averages give us an updated average price over a selected period of time.
The Simple Moving Average (SMA) and Exponential Moving Average (EMA) are mostly used by traders which calculate the average price in different ways.
With simple moving averages, all price points have the same value over the selected time period while an exponential moving average gives more value to recent prices.
In this article, we will explain different types of moving averages and you will learn how to use them in your trades.
Moving averages calculate the average price of an asset, like a stock or cryptocurrency, over a selected period of time.
Market prices tend to fluctuate frequently, making it difficult for traders to see the main direction of the trend.
Moving averages help us to see the trend easier by smoothing out these fluctuations and removing some irregular price points (A.K.A the market noise).
Moving averages are lagging indicators as they are calculated based on the previous market prices. Lagging indicators respond to price movements with delay and this delay may vary from one indicator to another.
Moving averages can have various time spans which affect the lag of the indicator.
For instance, a 100-day moving average gives us the average price for the last 100 days and its lag is greater than that of a 50-day moving average.
A moving average can be calculated in different ways. In this article, we explain three types of moving averages:
With various charting tools available today, you don’t need to calculate the moving averages yourself. However, it’s always good to know the basics and how they are actually measured.
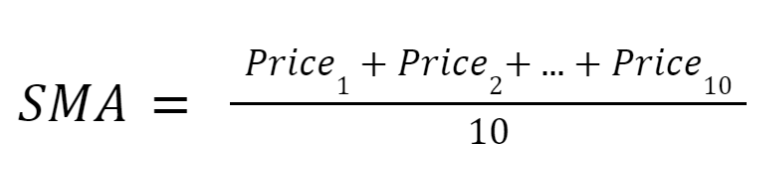
A simple moving average (SMA) is simply calculated by adding together the price points over the selected time period and then dividing it by the number of prices.
For example, if we want to calculate the 10-day SMA for an asset, we need to add up its prices over the past 10 days and divide it by 10:
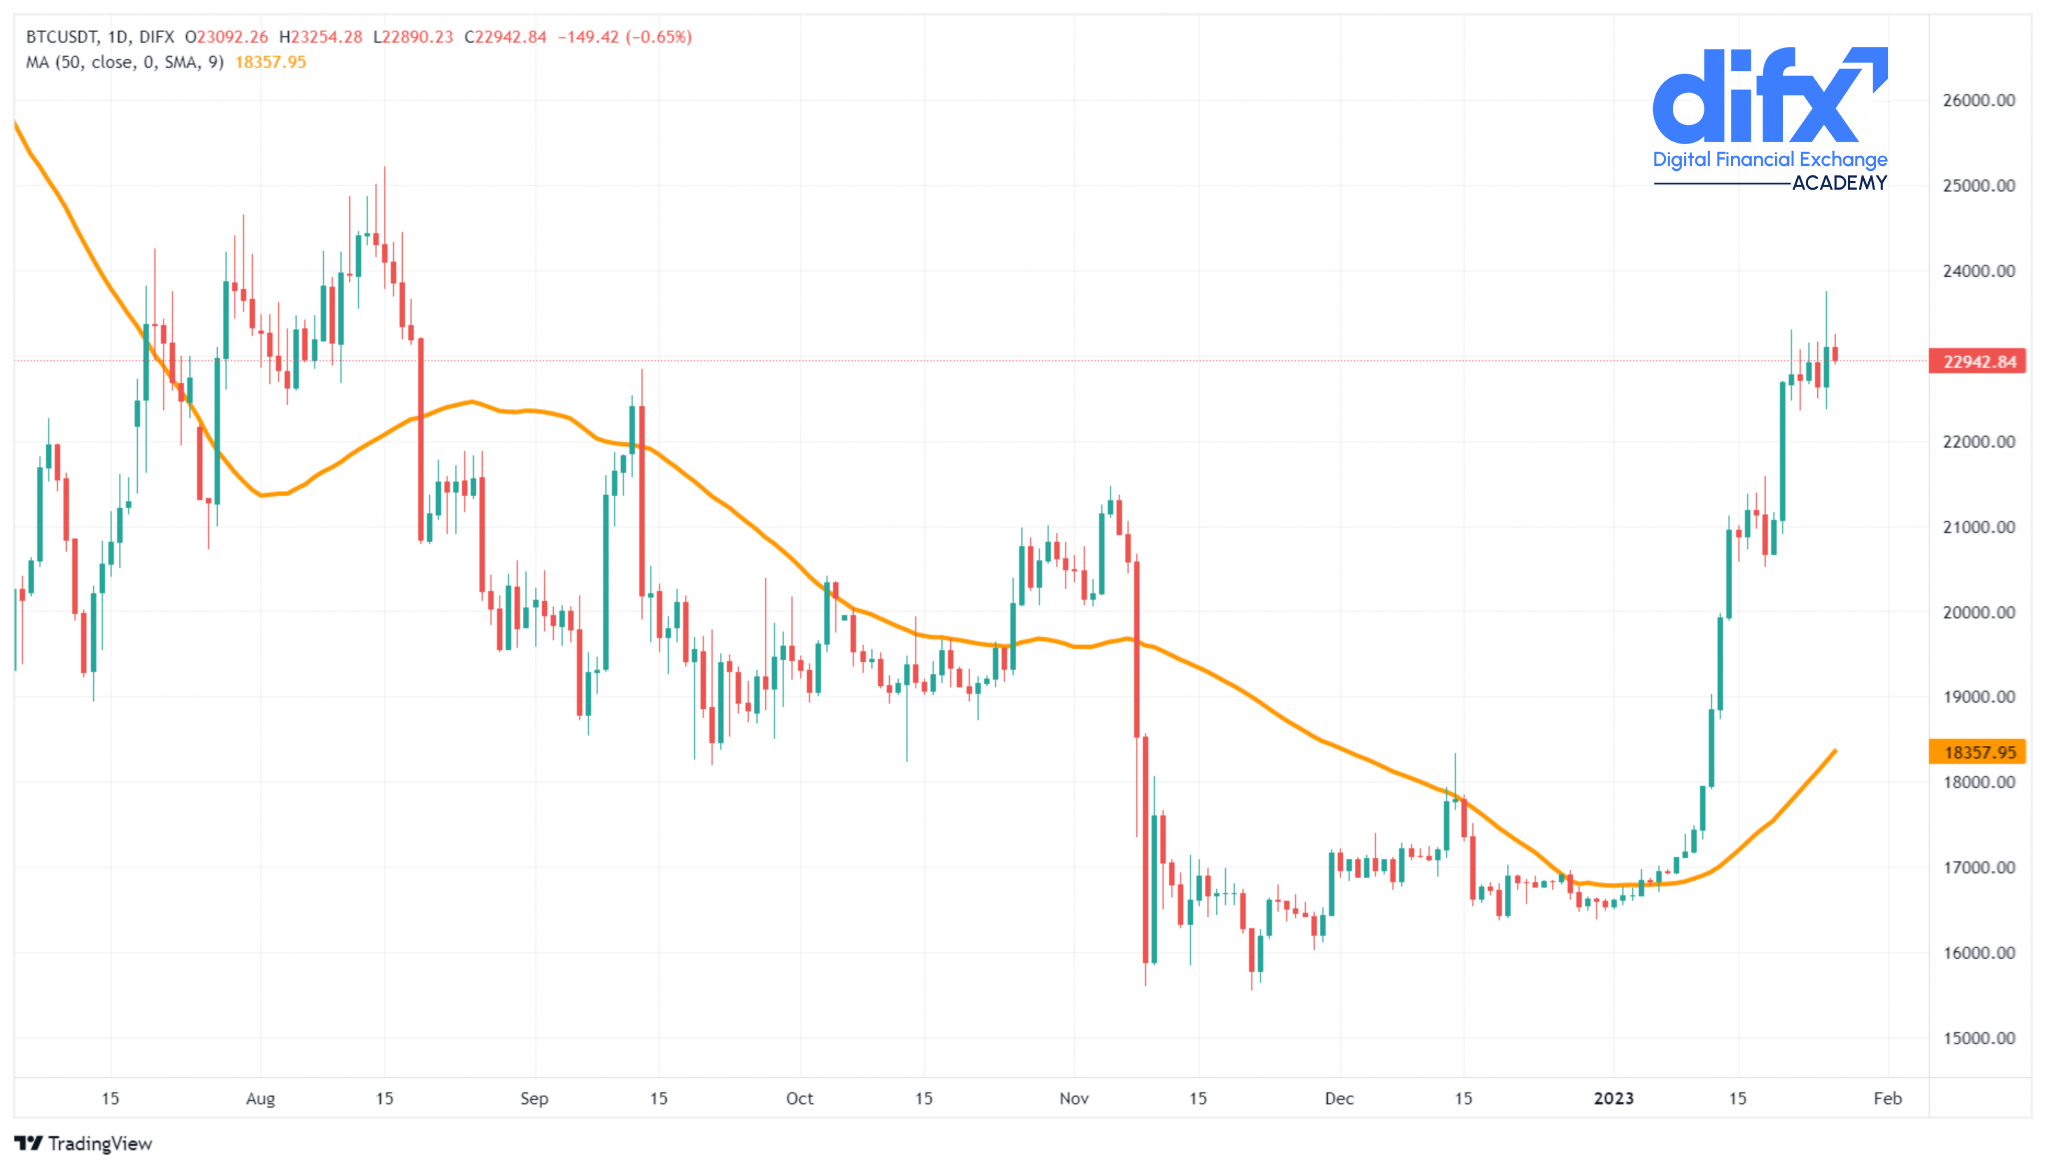
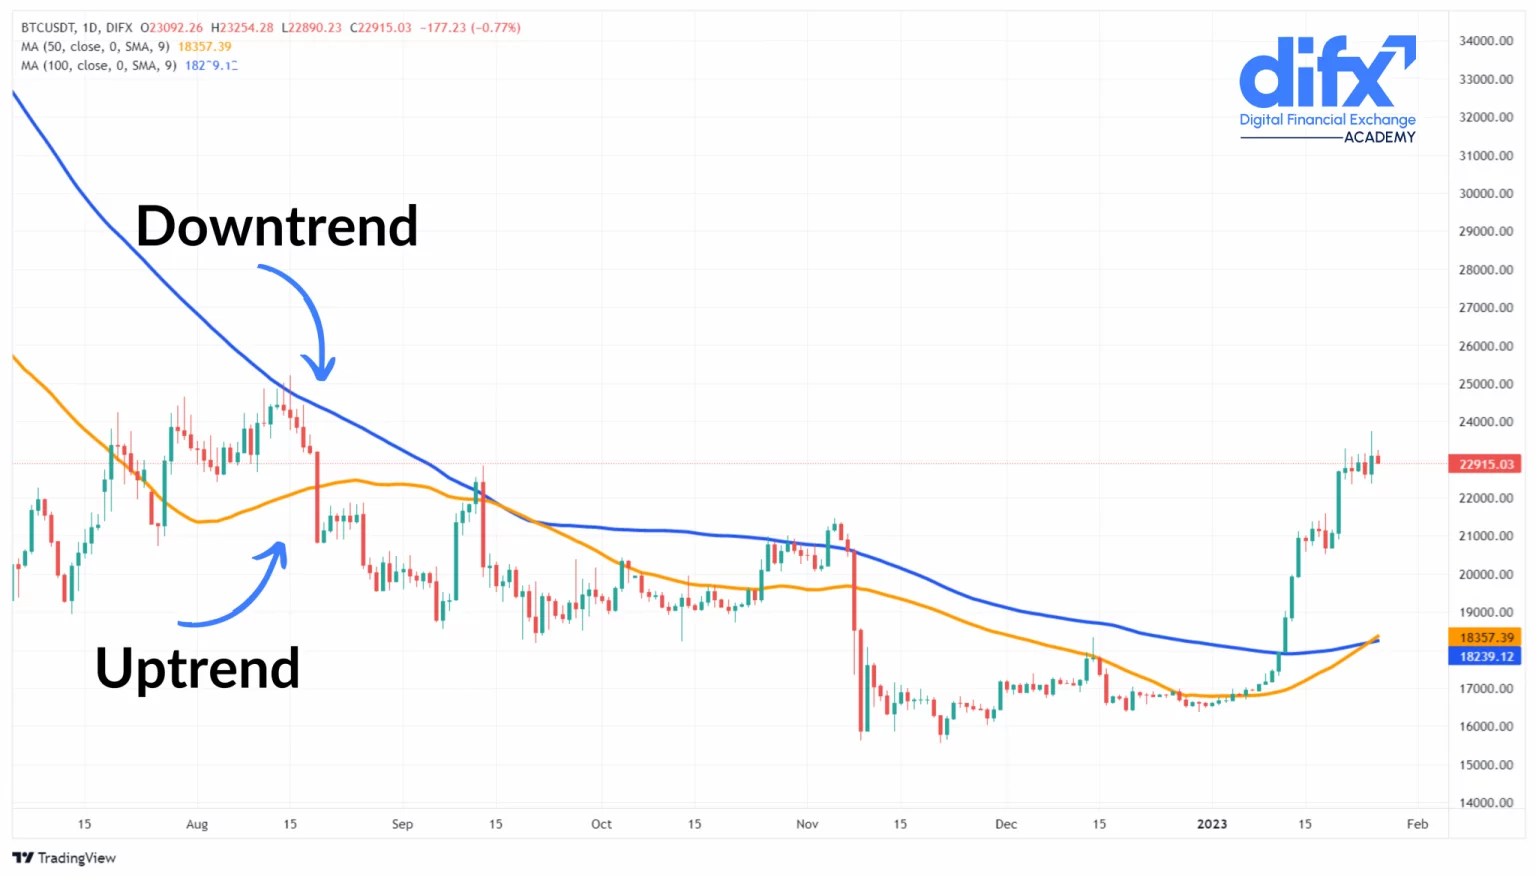
Here is how a 50-day SMA looks like in the chart below:
With an exponential moving average (EMA), more recent prices are considered more important and they have more weight in the calculation.
This weight is applied to the price values by a multiplier. Here’s the formula:
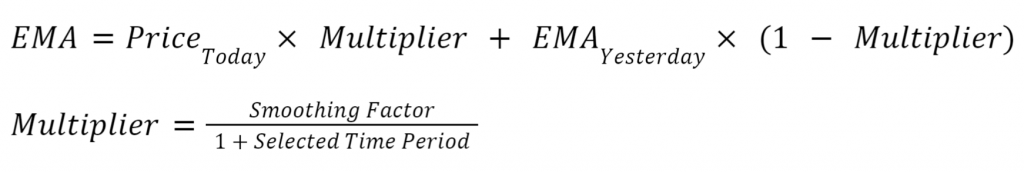
The Smoothing Factor can have different values, however, 2 is the most common choice.
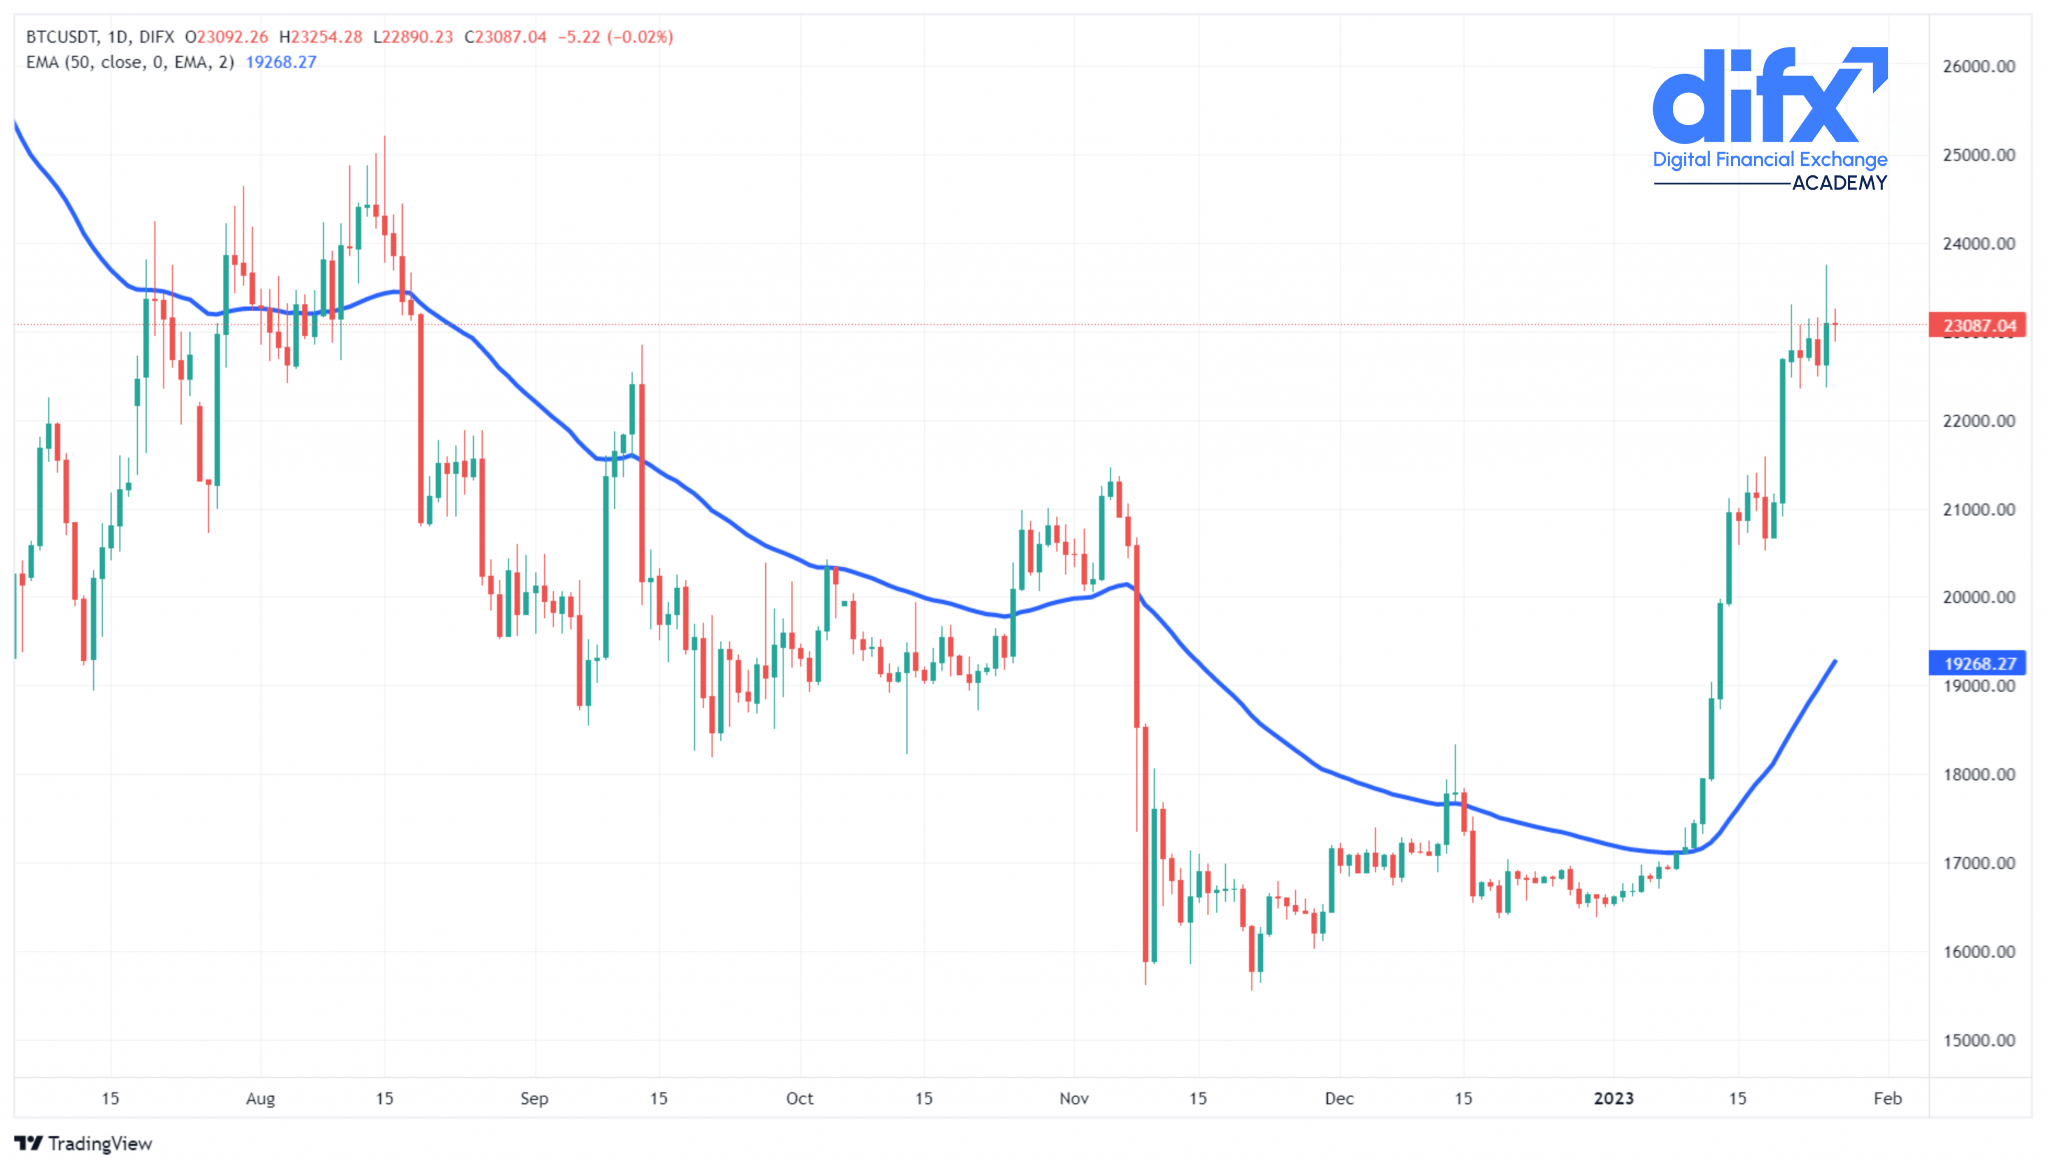
You can see a 50-day EMA in the chart below:
Just like EMA, a weighted moving average (WMA) gives more weight to more recent prices, however, these values are increased consistently, not exponentially.
In other words, the difference between the weight of Price 1 and Price 2 is equal to that of Price 2 and Price 3.
Here’s the formula for calculating WMA:
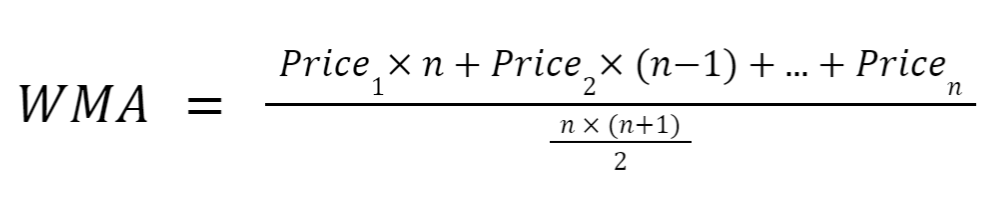
Where n is our selected time period.
You can see a 50-day WMA in the chart below:
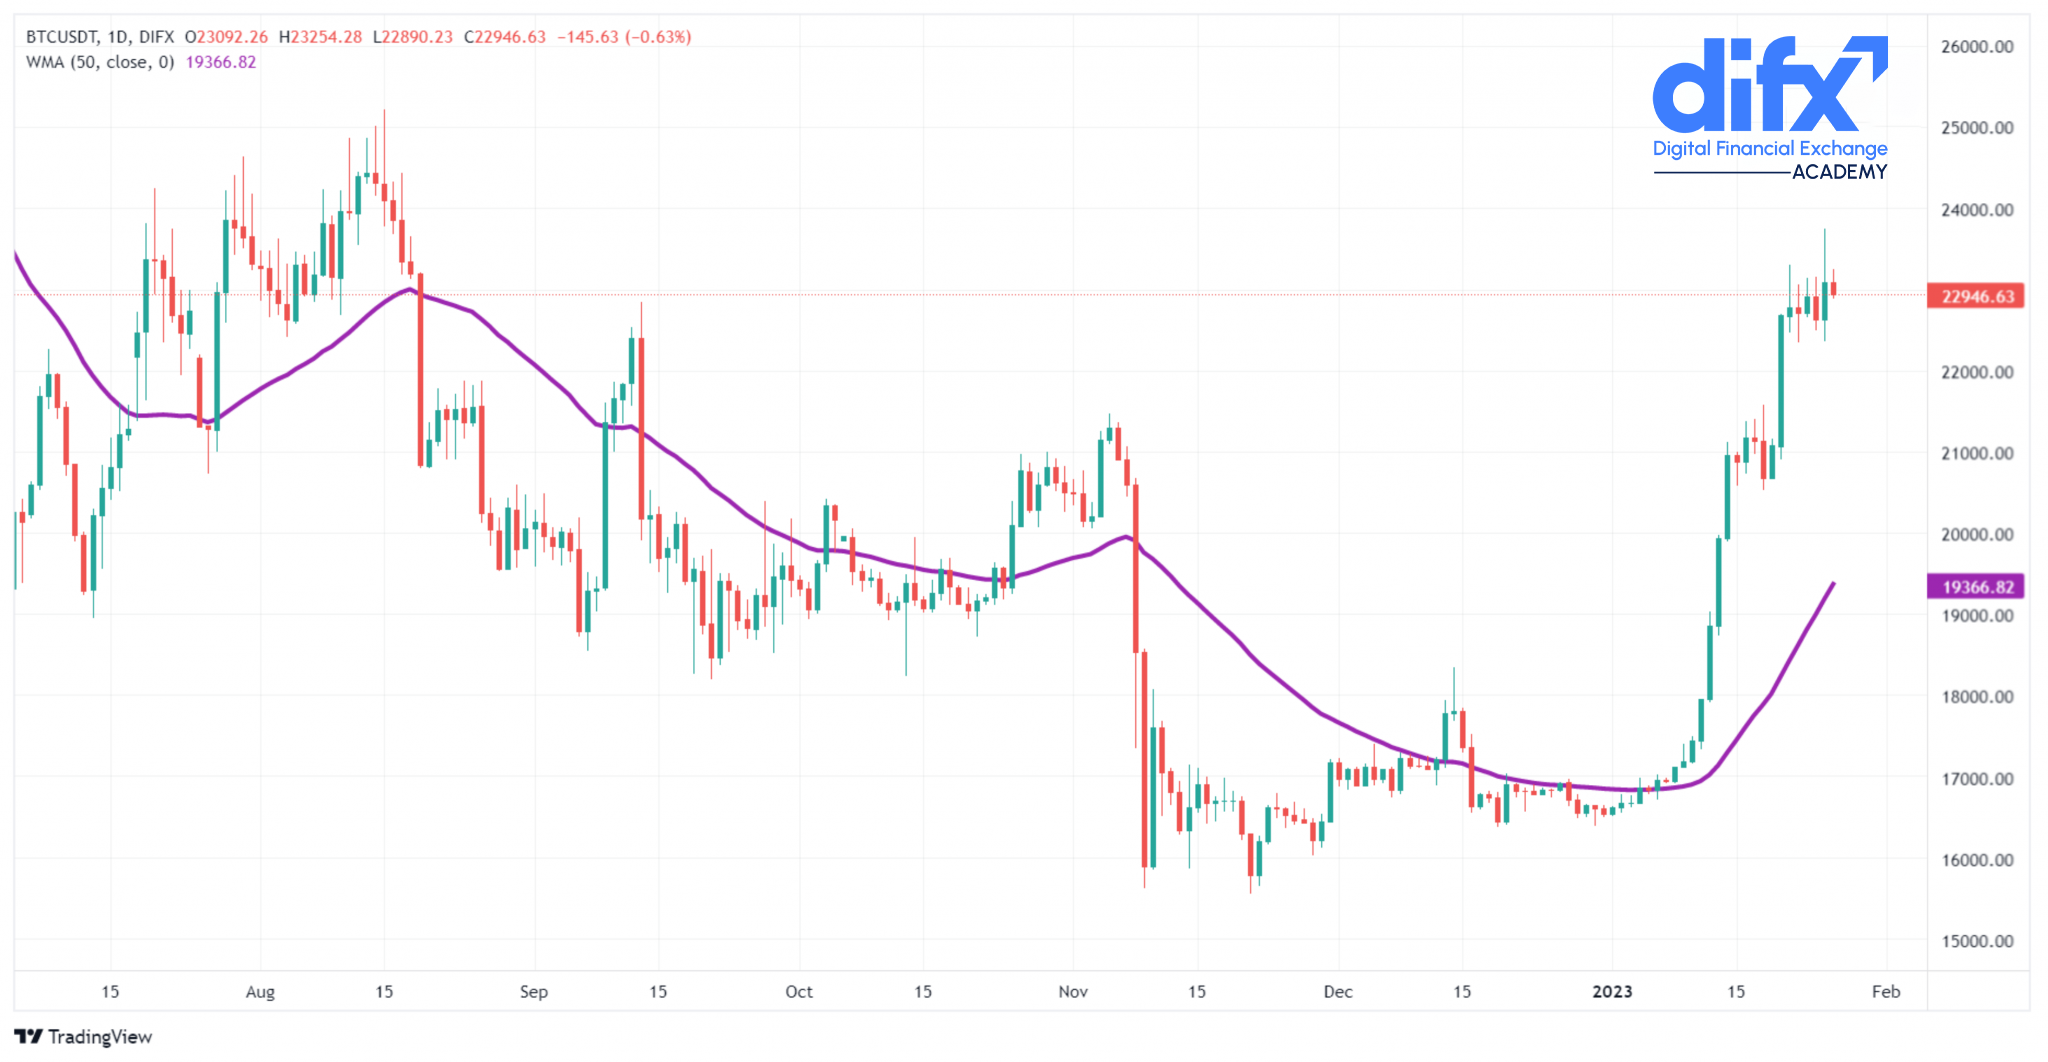
As we mentioned above, EMA gives more value to the recent prices. At the same time, SMA distributes this weight equally between all the price points in the selected time period. As a result, EMA reacts faster to market price movements than SMA.
In the chart below, you can see how EMA (the blue line) stays closer to the trend and reacts to the price change quicker than SMA (the orange line).
We cannot simply say that EMA is better than SMA, or the other way around.
EMA may react quicker to market fluctuations, helping traders and investors to avoid potential loss.
On the flip side, this fast reaction to price action may cause traders to react to something that is just market noise, losing potential profits.
In general, moving averages help us see the market trend by smoothing out price fluctuations and removing irregularities.
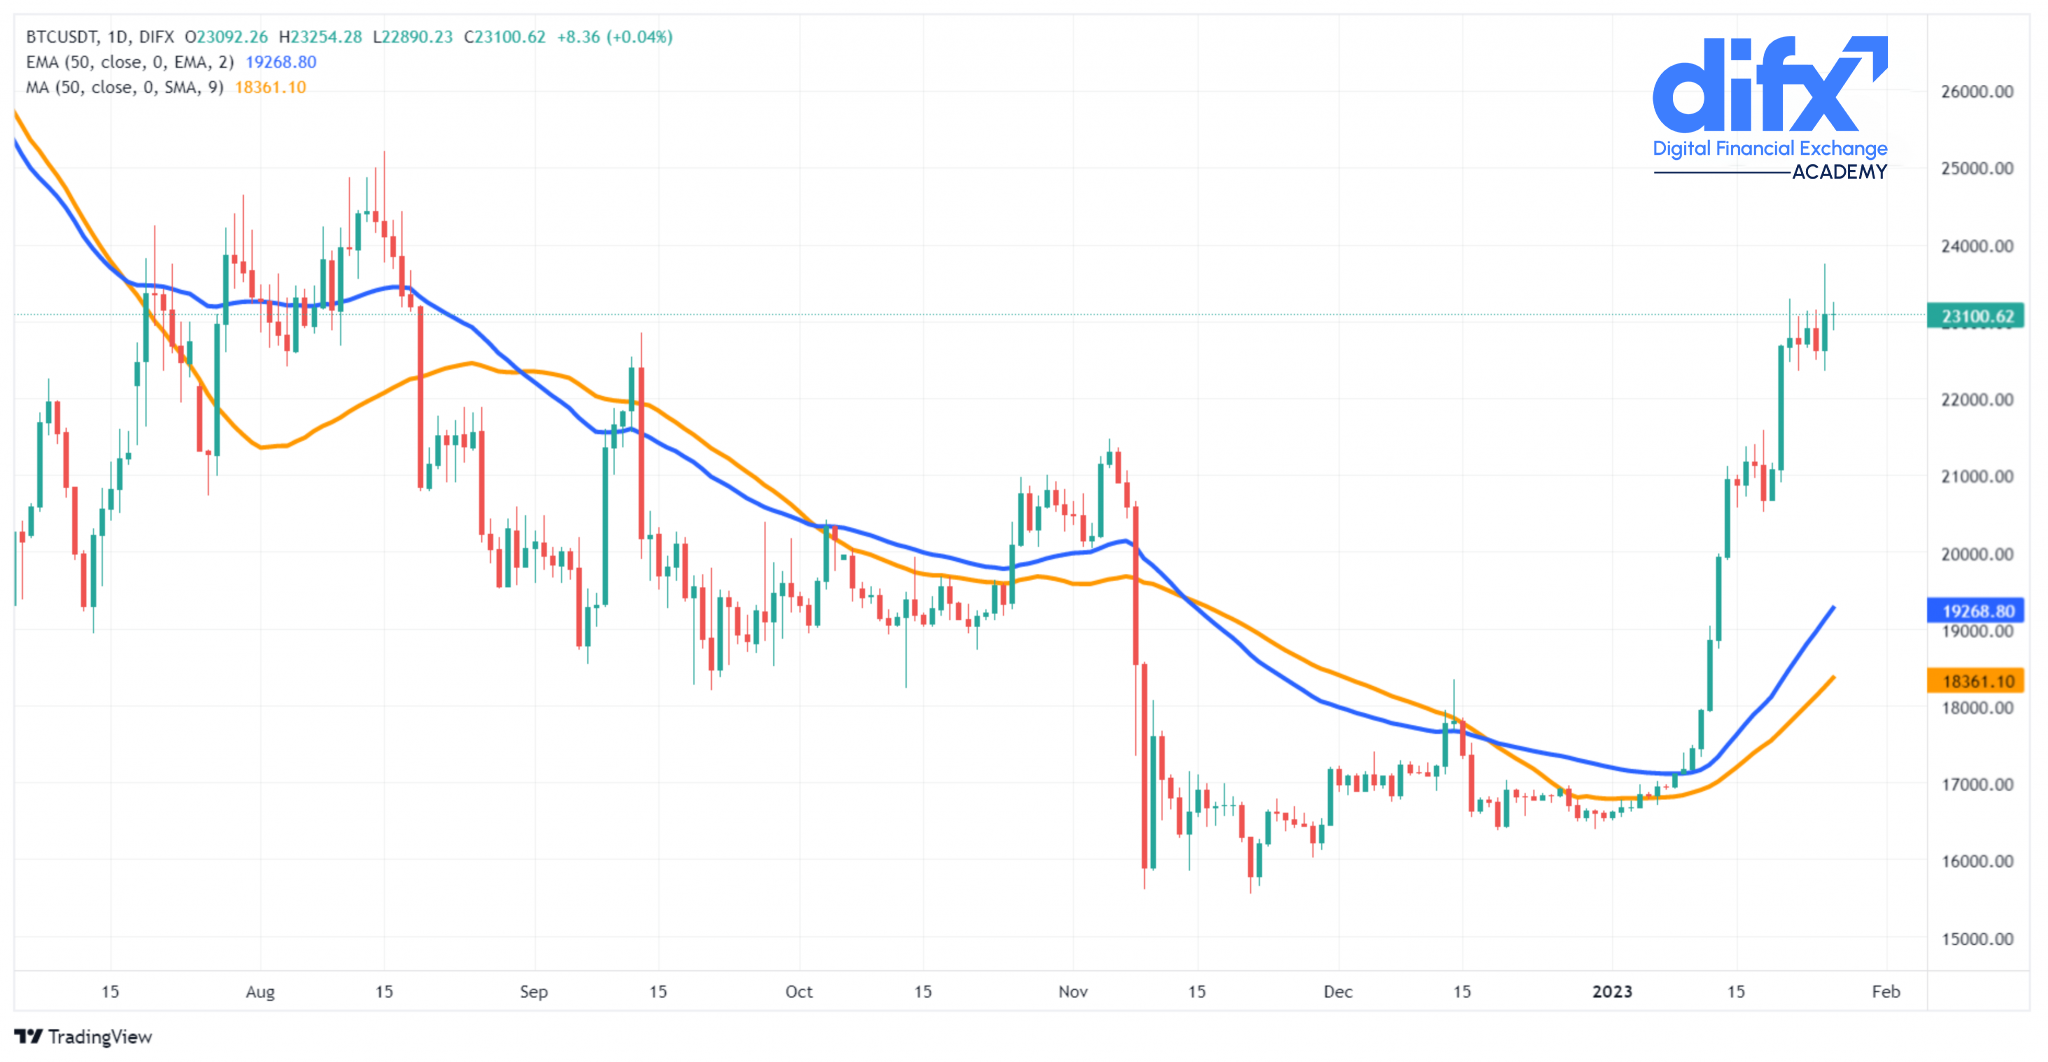
In general, if the moving average is below the price, we can say that the market is in an Uptrend.
On the other hand, if the moving average is above the price, the market is experiencing a Downtrend.
One thing we have to consider in this rule is that moving averages can be calculated for different time periods. Therefore, one moving average may show an uptrend while the other indicates a downtrend.
Here’s an example:
Moving averages are used in different candlestick patterns as well.
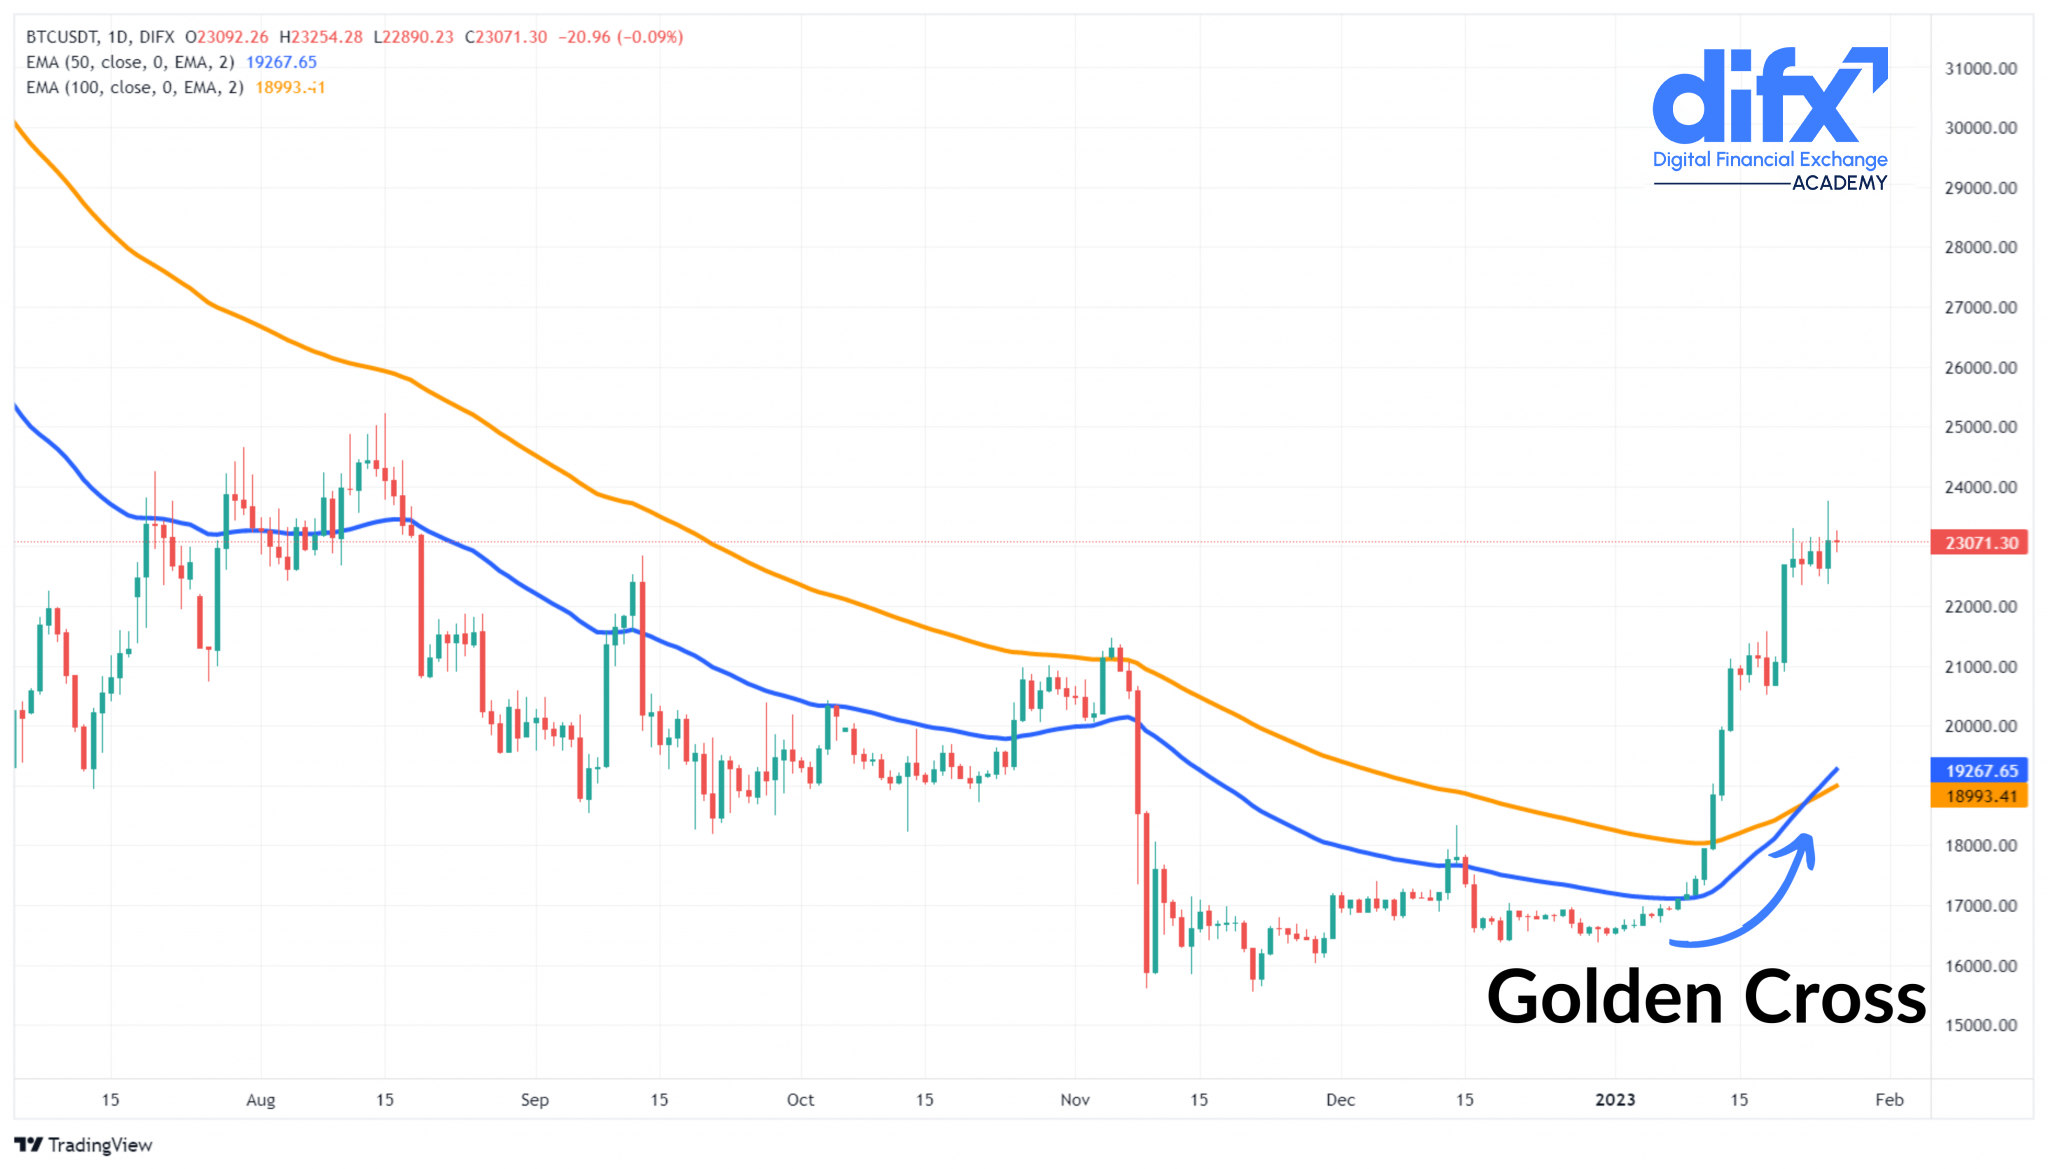
The golden cross is a bullish pattern and happens when a short-term moving average moves above a long-term moving average.
For example, we can see in the chart below that the 50-day EMA has broken above the 100-day EMA, forming a Golden Cross.
The death cross is just the opposite of the golden cross. If a short-term moving average breaks below a long-term moving average, a death cross is formed.
The death cross is a bearish pattern and indicates a downtrend.