
The Moving Average Convergence/Divergence or MACD is a technical indicator that is mostly used for finding trading opportunities by studying the trend and measuring the momentum in the markets. MACD can be used in any financial market including the cryptocurrency market.
MACD consists of multiple components: a MACD Line, a Signal Line, a Zero or Base Line, and a Histogram.
The MACD line is calculated by subtracting a long-term moving average from a short-term one and is then used to calculate the Signal Line which is also a moving average. In addition to these lines, the Histogram graphically shows us how much these two lines differ from one another.
In this article, we will discuss the basics of the MACD indicator and you will learn how to use it in your trading to better find entry and exit points in markets.
The Moving Average Convergence/Divergence, or MACD for short, is a momentum oscillator widely used in technical analysis. Traders and investors use MACD to find trends in markets and analyze the momentum to position their trades better.
MACD is calculated using Exponential Moving Averages or EMAs. In financial markets, a Moving Average (MA) is used to calculate the average price of a tradable asset, like stocks or cryptocurrencies, over a selected period of time.
While calculating this average price, an EMA considers recent prices more important by adding extra weight to them. In this way, an EMA reacts faster to price changes compared to a Simple Moving Average (SMA) which treats all the price points the same.
MACD uses two EMAs to calculate its main line and then another EMA is calculated based on this main line.
In general, the way these two lines behave and react to each other is what traders look at to assess the current market trend. We will talk about this in more detail in the last section.
The MACD indicator essentially consists of three main components: a MACD Line, a Signal Line, and a Histogram.
In this section, we will talk about each in detail and will see how they are calculated. With advanced charting tools available today, you won’t need to calculate MACD yourself. However, it is always a good idea to learn about the basics of the trading tools you use in your market analysis.
The MACD Line is calculated based on two long-term and short-term exponential moving averages.
By default, the time periods of these two EMAs are set at 12 and 26 which can be set up in minutes, hours, or days. You can change the default setting and adjust it based on your trading preferences.
As you can see in the formula below, we can calculate the MACD line by deducting the long EMA (26-period) from the short one (12-period):
MACD Line = 12 Period EMA -26 Period EMA
Based on the values of these two EMAs, the MACD line can have a positive or negative value. This makes the MACD line oscillate around the zero line by moving above or below it.
When the 12 Period EMA is more than (or above) the 26 Period EMA, the MACD line will be positive and above the zero line.
Conversely, whenever the 12 Period EMA is less than (or below) the 26 Period EMA, the MACD line will be negative and below the zero line.
This gives insights into the market condition which we will discuss in the “How to use MACD in trading” section.
The Signal Line is the exponential moving average of the MACD line. It is by default calculated as a 9-period EMA, however, just like the MACD line, you can change the default setting to match your trading setup.
The Histogram is the graphic representation of the difference between the MACD and Signal lines. It is calculated by subtracting the signal line from the MACD line.
The MACD histogram consists of bars and can be above or below the zero line based on its value.
Now, let’s see these components on a chart.
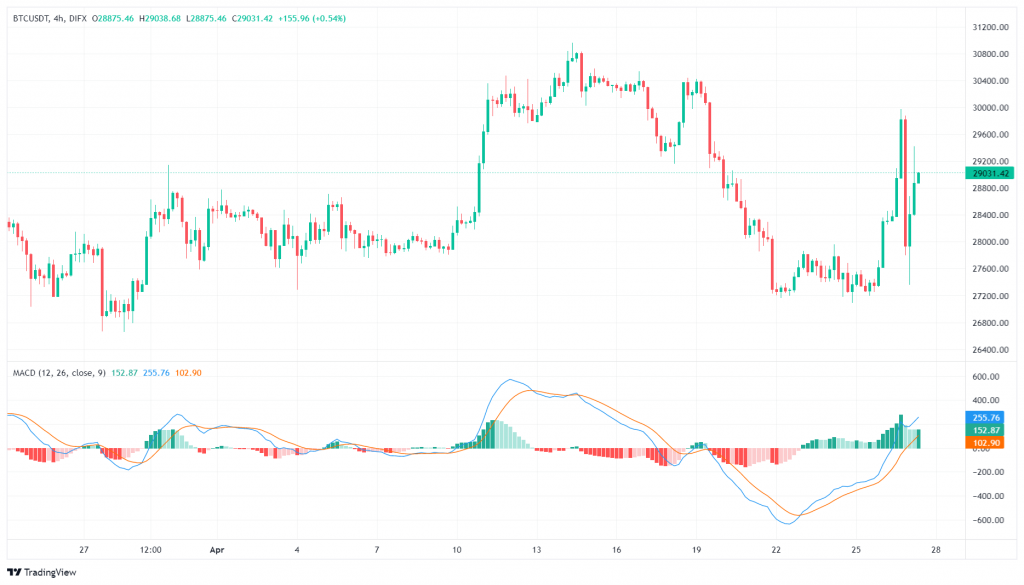
MACD Components on a Bitcoin Chart from the DIFX Spot Exchange
In the Bitcoin chart above, the blue line is the MACD line, the orange line is the signal line, and the green and red bars are the MACD histogram.
As mentioned above, traders and investors use MACD to see market trends and find profitable places to open a position or close an existing one.
To do this, traders need to study the MACD and signal lines and analyze the way they react to one another. The position of the MACD line in regard to the zero line is another factor that traders look into to understand the market trend.
Additionally, the MACD histogram can be used to measure momentum or how fast prices are changing which can be an indication of overbought or oversold market conditions.
The crossover happens when the MACD line and signal line cross each other which can indicate a bullish or bearish condition.
If the MACD line breaks the signal line to the upside and moves above it, the market is experiencing a bullish condition. Traders and investors consider this a good position for entering the market or buying.
On the flip side, if the MACD line moves below the signal line and breaks it to the downside, then the market is probably in a bearish state. Traders and investors usually close their positions and exit the market.
Another factor that can be considered here is the place where the crossover happens. A bullish crossover that is below the zero line can indicate that bearish sentiment is still lingering. On the contrary, a bearish crossover above the zero line can show that the market is still in a bullish state.
Now, let’s find crossovers in the chart below which shows Ethereum price movements.
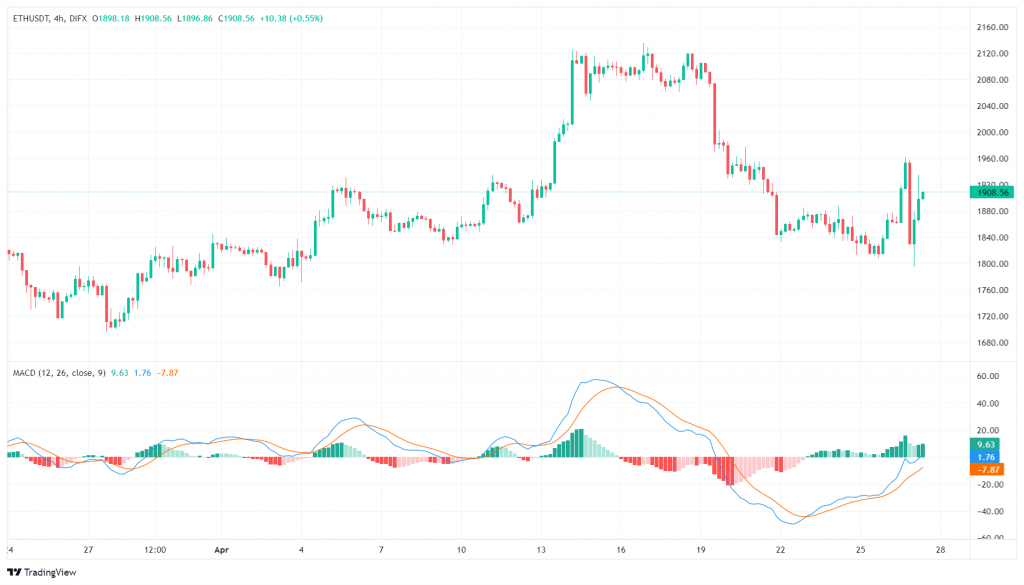
MACD Crossovers on an Ethereum Chart from the DIFX Spot Exchange
We can see that the signal line breaks the MACD line to the upside which is a bearish crossover. The crossover has happened above the zero line which indicates that the market may stay bullish, however, the price starts decreasing.
After that, a bullish crossover happens when the MACD line breaks the signal line to the upside and moves above it. Even though the crossover is below the zero line, the price starts its upward movement shortly after.
As mentioned before, the MACD line can be positive or negative and move above or below the zero line. We can also call this a crossover between the MACD line and the zero line which can be bullish or bearish.
The MACD line is positive and above the zero line when the short-term EMA (12-period) is above the long-term EMA (26-period), having greater value. This shows that the momentum is strong to the upside and traders usually consider this as a good position to buy or go long.
On the contrary, The MACD line is negative and below the zero line when the short-term EMA (12-period) is below the long-term EMA (26-period) which means it has a smaller value. This indicates that the momentum is strong to the downside and traders usually take this as a bearish sign to sell or go short.
Divergence happens when the MACD line and the price of the asset are not moving in the same direction.
For instance, the price of the asset may be in an uptrend, creating higher highs as it increases while MACD is creating lower highs, decreasing gradually.
MACD is an indicator of momentum or buying and selling pressure in the market. When MACD starts to decrease, we can say that the buying pressure is decreasing and a reversal may happen in the near future.
On the other hand, we may have a bullish divergence. Let’s say the price of the asset is decreasing, creating lower lows on its way down. However, MACD is increasing by creating higher lows.
In this situation, even though the price of the asset is falling, MACD indicates that the buying pressure is getting strong and a reversal may occur quite soon.