
Bollinger Bands are a technical tool that help traders to catch volatility and sharp price movements of an asset and find profitable entry and exit points.
If you want to learn more about Bollinger Bands and how they can be used in trading, this article is for you.
Bollinger Bands are a technical tool that help traders to catch volatility and sharp price movements of an asset and find profitable entry and exit points. Traders can use Bollinger Bands to spot overbought and oversold conditions as well.
Three lines or bands are the main components of Bollinger Bands: the middle band, the upper band, and the lower band. The middle band is a simple moving average that shows the average price of the asset over a predetermined period of time.
The upper and lower bands, on the other hand, show how far the prices in the selected period are from the average price. Traders look into the ways these three bands react to one another to determine the market condition and leverage that in their trading decisions.
This is just a short overview of what we’re going to discuss in this article. If you want to learn more about Bollinger Bands and how they can be used in trading, this article is for you.
Now, let’s dig a little deeper to understand how Bollinger Bands work and where they come from!
John Bollinger, an American financial analyst, invented Bollinger Bands in 1983 and later on, published his “Bollinger on Bollinger Bands” book in 2001.
With Bollinger Bands, you would be able to see sharp price movements and volatility and spot overbought or oversold conditions. Bollinger Bands are visually easy to read and can be helpful to traders with any level of proficiency.
Bollinger Bands consist of three main lines or bands:
Now, let’s quickly go through some of the concepts mentioned above: a simple moving average and the standard deviation.
A moving average provides the average price of an asset over a selected period of time. A simple moving average treats all the data points (prices) in the given period equally while an exponential moving average gives more value to recent prices.
You can check out our “What is a Moving Average?” article to learn more about simple and exponential moving averages and how they are calculated.
We mentioned that Bollinger Bands use a 20-period simple moving average. This period can be 15 minutes, 1 hour, or 1 day and is selected by traders based on their trading setup and preferences.
Now, let’s see what the standard deviation is.
In general, standard deviation measures the difference between a given set of data points with the average value. In other words, it shows us how far the values are from the typical average value.
In Bollinger Bands, to plot the upper band, the value of two standard deviations is calculated for the selected period (20) and then added to the simple moving average or the middle band. Conversely, the value of two standard deviations is subtracted from the simple moving average to create the lower band.
The chart below shows Bollinger Bands with the standard setup for Bitcoin.
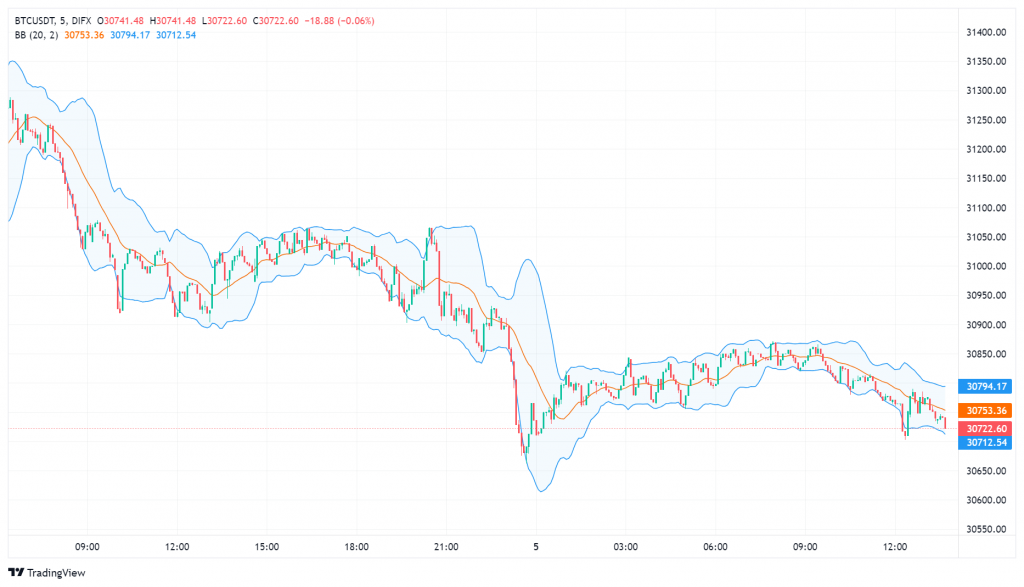
The Bollinger Bands on a Bitcoin chart – DIFX spot exchange
The middle band is plotted in orange and you can see the upper band and lower band on either side of it in blue. As you can see, the distance between the two upper and lower bands changes which we will discuss in the next section.
The Bollinger Bands in this chart is following the typical setup of 20, 2. You can change this setup according to your preferences by changing the tool’s settings.
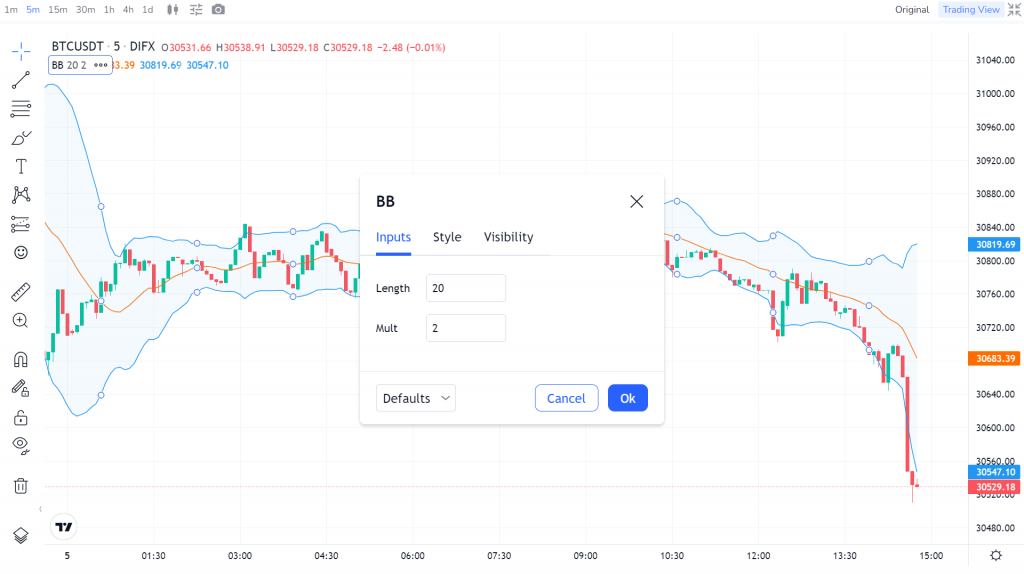
The Bollinger Bands Settings – DIFX spot exchange
You can use a 10-period setup for short-term trading and a 50-period setup for long-term one. You should note that according to John Bollinger, the standard deviation needs to be adjusted as well:
In general, the upper band and lower band tend to stay closer to the middle band when the market is going through a period of low volatility. On the flip side, when the asset is experiencing sharp price movements, the two bands move wider apart from each other.
In both scenarios, a change in the market can be expected. If the bands are closer to each other (the squeeze), more volatility may be on its way. On the other hand, when the bands are apart from each other, the market may calm down soon, ending the current trend.
What’s important here is that Bollinger Bands don’t show when these changes may happen or what direction the price may take. They simply indicate that a change in the market condition COULD happen.
To spot the potential overbought or oversold conditions, we need to see how the price is reacting to the upper and lower bands. If the price is close to the upper band or has touched it on multiple occasions, we can say that the market is in an overbought condition. On the other hand, if the price is constantly touching the lower band, we can assume that the market is in an oversold condition.
The price may also break out on either side and move above or below the upper and lower bands. John Bollinger specifically mentions in his book that these breakouts shouldn’t be considered trading signals on their own:
“The single mistake most often made with bands, envelopes, or channels is to blindly sell a tag of the upper ban’ and/or buy a tag of the lower band. If such tags are parts of large patterns or are unconfirmed by indicators, they may in fact constitute buy or sell signals-but then again, they may not.