
The Relative Strength Index (RSI) is one of the most widely used indicators in the realm of technical analysis.
Traders use RSI to evaluate the market condition of an asset. RSI takes a value between zero and 100 and based on the value of its reading, traders and investors can see whether the asset is in Overbought or Oversold territory.
In this article, we will talk about RSI and its history and calculation, and you will learn how to use this indicator in your technical analysis.
Relative Strength Index or RSI is a popular momentum indicator widely used in technical analysis. As a momentum indicator, RSI measures the strength or weakness of the price of an asset.
RSI helps traders and investors assess the price action and see who is affecting it the most: market members who are overselling or overbuying.
RSI is an oscillator and can take a value between 0 and 100. It is usually calculated over 14 days but the setting can be changed based on the traders’ preference.
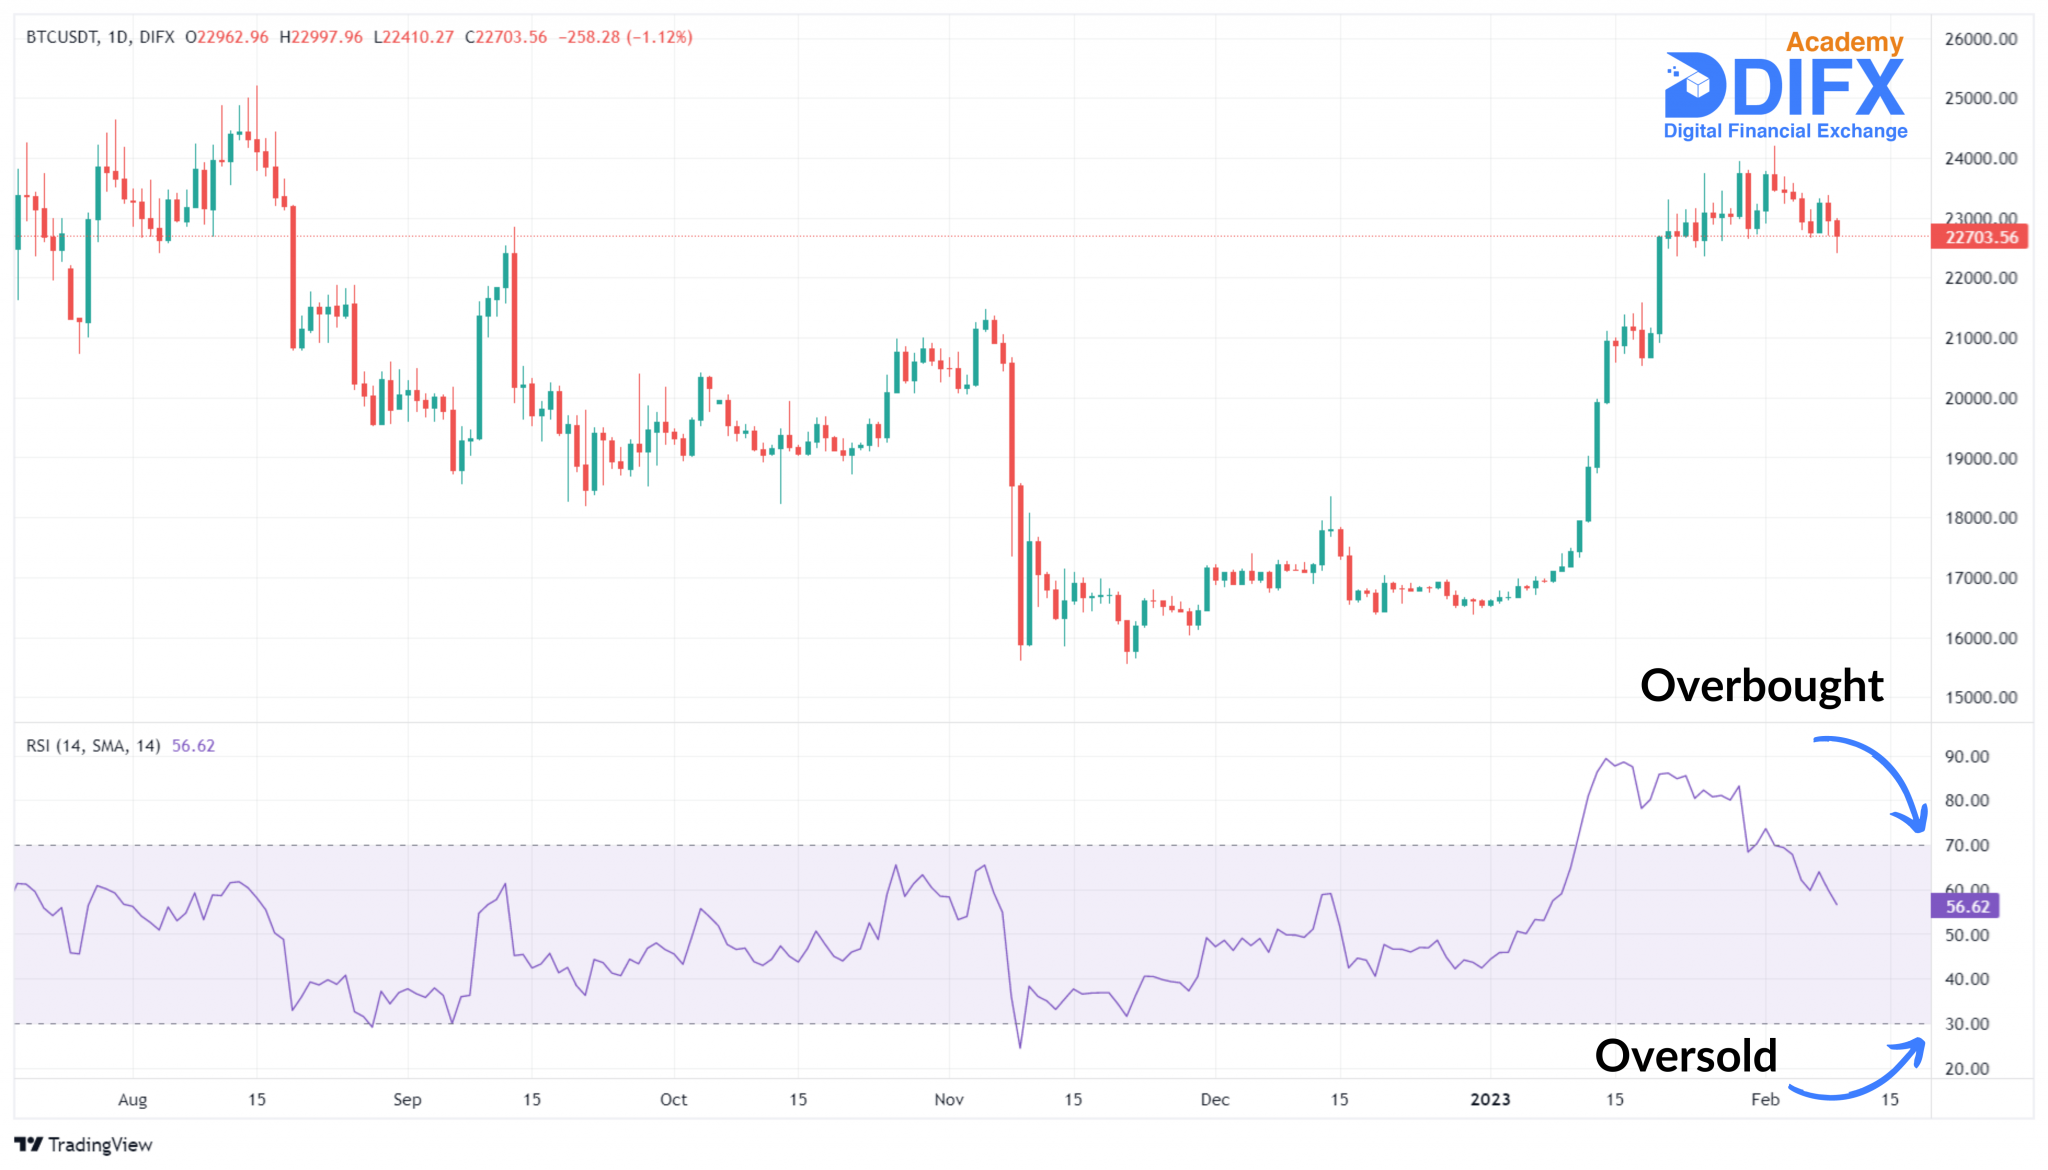
Traders and investors normally use the standard setting of 30 and 70 for the RSI. If RSI is valued at 70 or above, we can say that the market is experiencing an overbought condition.
On the other hand, an RSI reading of 30 or below can be considered an indication of an oversold market condition. Lastly, a reading of 50 shows a neutral state between bulls and bears.
Some traders set the higher and lower bands at 80 and 20, respectively. This is when RSI tends to be more volatile and frequently surpasses the 70 and 30 levels.
In 1978, J. Welles Wilder Jr., an American mechanical engineer first introduced the Relative Strength Index (RSI) in his book “New Concepts in Technical Trading Systems”.
Wilder stated that the sharp increase in the price can indicate an overbought situation. In other words, the price will reach its top shortly and start to reverse.
On the contrary, if the price decreases sharply, the market is experiencing an oversold situation. In other words, the price will find its bottom in the near future and start to rise again.
Wilder also compared the price action and RSI to further analyze the markets. A divergence between RSI and the price action happens when the two move in opposite directions.
This divergence can be bearish and bullish, adding more insights about the direction the market is headed.
With today’s advanced charting tools, you really don’t need to calculate RSI by yourself.
You can simply choose the option and do your market analysis based on it. However, it’s always a good idea to know the basics of the tools you use.
Essentially, RSI compares the strength of upward price movements with the strength of downward price movements in a selected period of time.
Traders usually set this period to 14 days, however, shorter time periods (e.g. hourly) can be set for short-term market analysis.
To measure this, RSI uses the formula below:
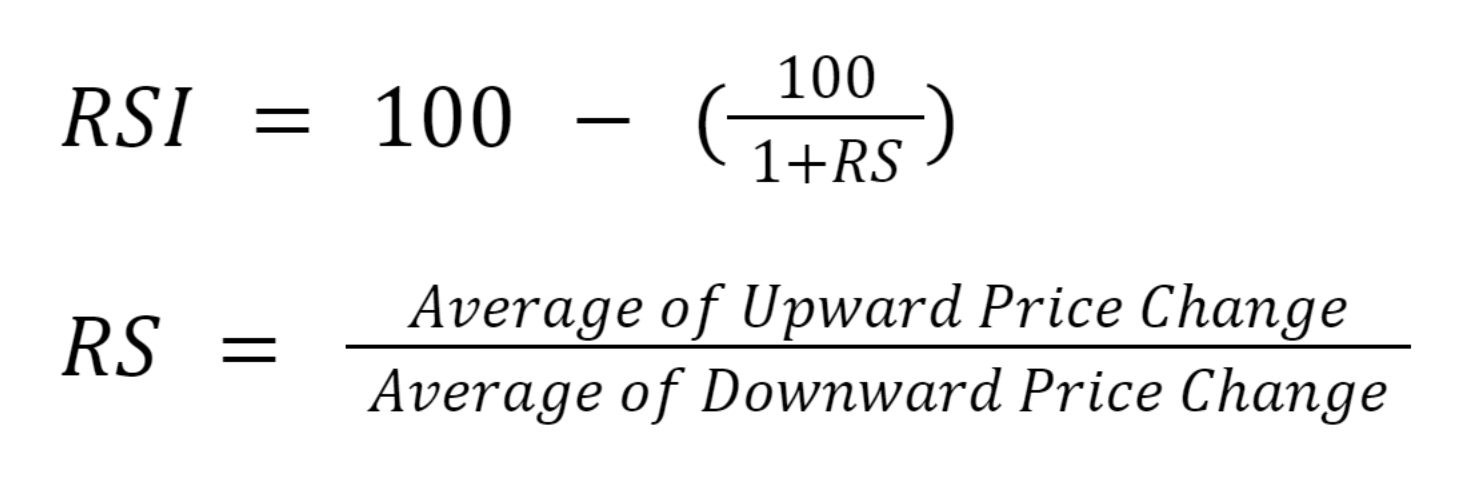
Where RS is the Relative Strength factor which compares the strength of upward and downward movements during the selected time period.
Through the RSI formula then, the value of RS is converted to a number between 0 and 100.
Traders and investors can use RSI in different ways. Let’s take a quick look at some of the ways RSI is used in the markets.
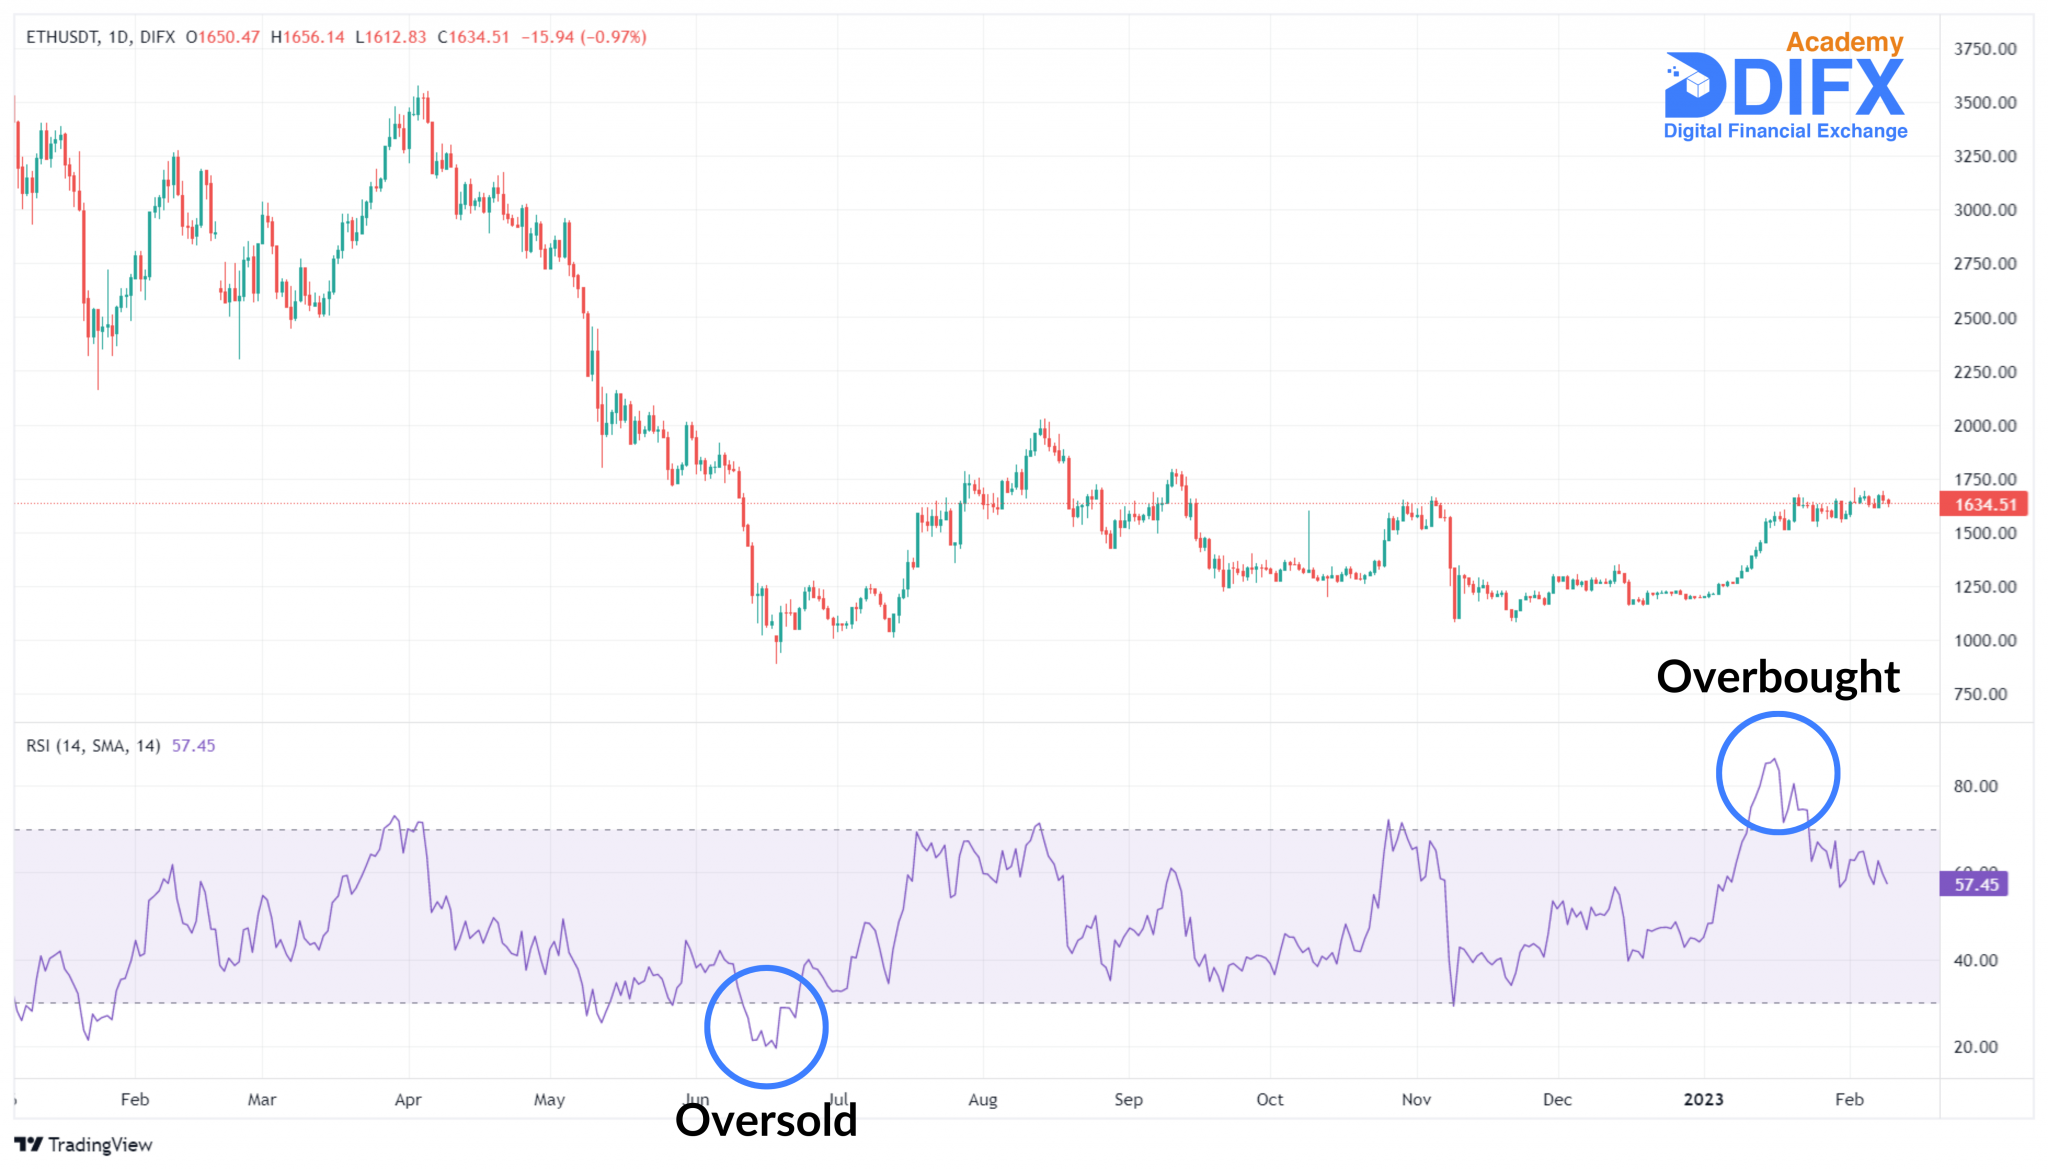
The basic principle of RSI is based on the 30 and 70 levels. As we mentioned before, if RSI is reading at 30 or below, the asset is oversold. Simply put, the asset is undervalued, meaning its price is lower than its true value.
In this situation, the price may find its bottom soon and start increasing again. Traders usually wait for a confirmation that a price reversal is imminent to enter and buy the asset.
On the contrary, a reading of 70 or above for RSI indicates an overbought condition. This simply means that the asset is overbought or overvalued. In other words, the price of the asset is higher than its true value.
In this condition, the price will reach its peak quite soon and start a downtrend. Traders usually look for confirmation that a price reversal is going to happen in the near future to sell the asset.
An RSI divergence occurs when the price of the asset and RSI are moving in the opposite direction.
RSI can form bullish or bearish divergence: